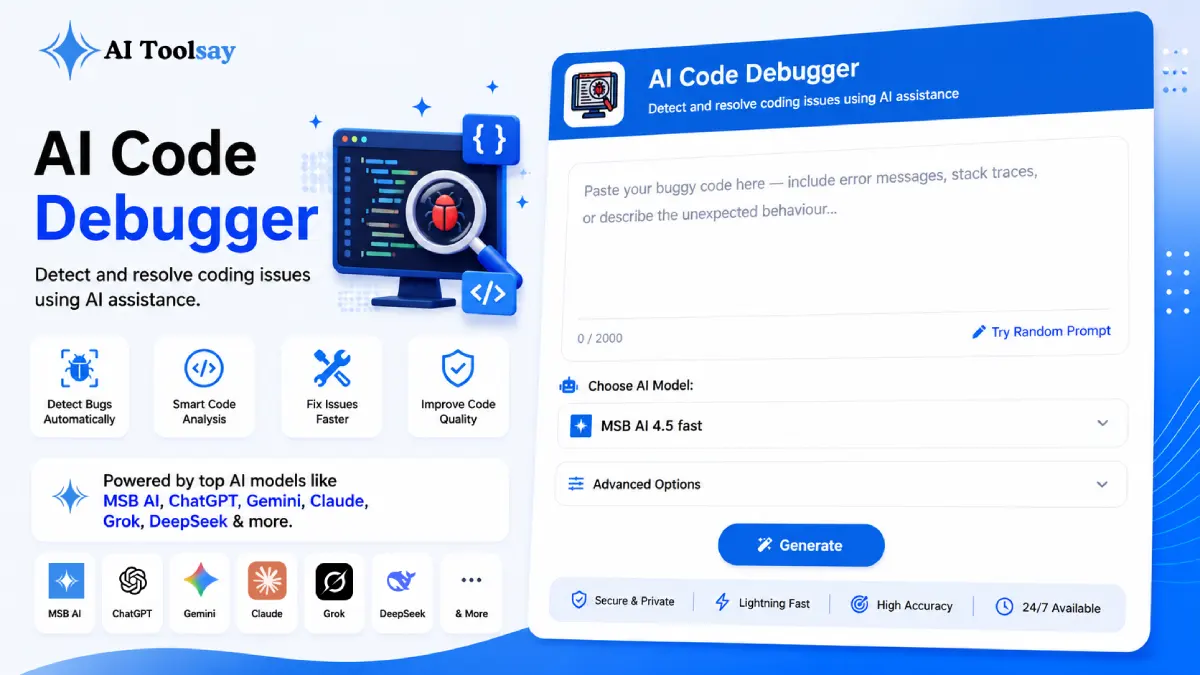
AI Code Debugger
Detect and resolve coding issues using AI assistance
MSB AI 4.5 fast
Your prompt will appear here…
Your beautifully formatted article will appear here once you generate.
No history yet
Your generations will appear here. Sign in to save them permanently.
Rate this tool
Sign in to rate this tool.
Sign in →Are you spending hours searching for a missing semicolon, unexpected runtime error, broken API response, or confusing logic bug? Have you ever wondered why your code works in one environment but fails in another? Looking for a faster way to identify programming mistakes without manually reviewing hundreds of lines of code?
If these challenges sound familiar, an AI Code Debugger can help. Modern AI-powered debugging tools analyze source code, detect potential issues, explain root causes, suggest fixes, and even generate corrected code within seconds.
This guide explains everything you need to know about the AI Code Debugger available on AIToolsay, including features, benefits, workflows, use cases, comparisons, SEO advantages, and practical tips for getting the best debugging results.
Quick Answer: An AI Code Debugger is an AI-powered coding assistant that analyzes source code, identifies syntax, logic, runtime, security, database, API, and performance issues, explains the root cause of problems, and recommends fixes. The AIToolsay AI Code Debugger supports multiple programming languages, frameworks, debugging styles, and advanced correction options to help developers debug faster and write better code.
What is AI Code Debugger?
An AI Code Debugger is an intelligent software tool designed to automatically inspect code, detect errors, explain issues, and recommend solutions. Unlike traditional debuggers that require manual breakpoints and step-by-step execution, AI-powered debugging systems understand code context and provide meaningful guidance.
The tool acts as a free AI code debugger that can help developers, students, software engineers, freelancers, startup teams, and technical professionals identify coding issues more efficiently.
Instead of spending hours locating bugs manually, users can paste code, choose debugging preferences, and receive detailed reports explaining what is wrong and how to fix it.
How Does AI Code Debugger Work?
The AIToolsay AI Code Debugger follows a streamlined workflow that transforms complex debugging into a simple guided process.
Prompt Input Area
Users begin by pasting source code, stack traces, error messages, API logs, database queries, or application snippets into the input area.
You can also describe the problem in natural language. For example:
My Laravel login form returns a 419 CSRF token mismatch error after deployment.
AIToolsay Creator
AI Model Selector
Users can choose from premium AI models available on AIToolsay. Different models may excel at specific programming tasks, architecture reviews, code analysis, bug fixing, optimization, or explanation generation.
AIToolsay provides access to advanced AI technologies from multiple providers through a single interface.
Advanced Options Accordion
The advanced settings allow users to customize debugging results for specific development requirements.
Programming Language
- PHP
- JavaScript
- Python
- Java
- C++
- C#
- TypeScript
- Go
- Rust
- Swift
- Kotlin
Framework / Library
- Laravel
- React
- Vue
- Next.js
- Node.js
- Django
- Flask
- Express
- Tailwind CSS
- Bootstrap
- None
Debugging Focus
- Syntax Errors
- Runtime Errors
- Logic Errors
- Performance Issues
- Security Issues
- API Errors
- Database Errors
- UI Bugs
Explanation Style
- Beginner Friendly
- Technical
- Step-by-Step
- Detailed
- Simplified
Available Toggles
- Include Error Explanation
- Suggest Fixes
- Generate Corrected Code
- Include Best Practices
- Optimize Performance
- Security Check
- Include Code Comments
- Explain Root Cause
- Generate Refactored Version
Output Format Options
- Plain Text
- Markdown
- Step-by-Step Report
- Developer Notes
Generate Multiple Solutions
- 1 Solution
- 3 Solutions
- 5 Solutions
Custom Prompt Area
Developers can add framework-specific instructions, project standards, architecture requirements, coding guidelines, and debugging notes.
Generate Button
After selecting preferences, users click Generate to begin AI-powered code analysis.
Output Section
The AI produces a structured debugging report containing detected issues, explanations, root causes, recommendations, corrected code, and optimization suggestions.
Export Tools
Generated debugging reports can be exported for documentation, collaboration, bug tracking, or code review workflows.
Activity History Panel
Users can revisit previous debugging sessions, compare fixes, and maintain a record of code improvements over time.
Key Features of AI Code Debugger
Multi-Language Support
Analyze code written in popular programming languages and modern development environments.
Deep Error Detection
Identify syntax, runtime, logic, and structural issues automatically.
Bug Explanation Engine
Receive detailed explanations of why issues occur and how to prevent them.
Automated Fix Suggestions
Get recommended fixes and implementation guidance instantly.
Security Analysis
Detect vulnerable coding patterns and security risks.
Performance Optimization
Discover inefficient code and opportunities for improvement.
Corrected Code Generation
Create cleaner, functional code versions with minimal effort.
Framework Awareness
Understand Laravel, React, Vue, Django, and other frameworks.
Productivity Enhancement
Reduce debugging time and accelerate development cycles.
Benefits of Using AI Code Debugger
- Find coding errors significantly faster.
- Improve development productivity.
- Understand complex bugs more clearly.
- Reduce manual troubleshooting.
- Improve code quality and maintainability.
- Learn best practices while debugging.
- Enhance application security.
- Optimize application performance.
- Support collaborative development workflows.
Best Use Cases for AI Code Debugger
- Debugging web applications.
- Investigating API failures.
- Resolving database query issues.
- Reviewing production errors.
- Analyzing frontend UI bugs.
- Learning programming concepts.
- Code review assistance.
- Performance troubleshooting.
- Security vulnerability detection.
- Refactoring legacy code.
Step-by-Step Guide to Using AI Code Debugger
Getting started with the AI Code Debugger is straightforward. Whether you are a beginner learning programming or an experienced developer maintaining large applications, the process remains simple and efficient.
- Open the AI Code Debugger tool.
- Paste your source code or error message into the input area.
- Select the programming language.
- Choose the relevant framework or library.
- Select the debugging focus area.
- Choose your preferred explanation style.
- Enable optional debugging enhancements.
- Add custom instructions if needed.
- Click Generate.
- Review the AI-generated debugging report.
- Apply recommended fixes.
- Test the updated code.
For best results, include complete error messages, stack traces, and relevant code sections. The more context you provide, the better the debugging recommendations become.
Why Choose AI Code Debugger on AIToolsay?
The AIToolsay platform is designed to provide powerful AI capabilities without unnecessary complexity. Instead of managing multiple subscriptions and platforms, developers can access various premium AI models from a single dashboard.
Unlike many limited debugging tools, AIToolsay combines flexibility, accessibility, and advanced AI technologies to help developers solve coding problems efficiently.
- Completely free access.
- Multiple AI model choices.
- Developer-focused workflow.
- Advanced debugging customization.
- Framework-aware analysis.
- Security and performance recommendations.
- Exportable debugging reports.
- Activity history management.
- Beginner-friendly interface.
Learn more about the platform at AIToolsay.
AI Code Debugger AI Models Comparison
Different AI models may provide unique strengths when performing debugging tasks.
| AI Model Type | Best For | Strength | Typical Use Case |
|---|---|---|---|
| General Coding Models | Everyday debugging | Balanced performance | Application development |
| Reasoning Models | Complex logic issues | Deep analysis | Algorithm debugging |
| Code Generation Models | Code correction | Fast fixes | Bug resolution |
| Large Context Models | Large projects | Broader understanding | Enterprise applications |
| Security-Oriented Models | Vulnerability reviews | Risk detection | Secure coding audits |
SEO Benefits of AI Code Debugger
Although primarily designed for developers, the AI Code Debugger can also support technical content creation and software documentation efforts.
- Generate cleaner code examples for tutorials.
- Improve code quality in technical blogs.
- Reduce inaccurate implementation examples.
- Support developer documentation creation.
- Create educational programming resources.
- Improve technical article credibility.
Teams creating software-related content can use debugging reports as educational references when publishing coding tutorials and development guides.
Tips to Get Better Results with AI Code Debugger
The quality of debugging output often depends on the information provided. Following these practices helps maximize accuracy.
- Provide complete code snippets.
- Include exact error messages.
- Mention framework versions.
- Describe expected behavior.
- Explain actual behavior.
- Specify database technologies when relevant.
- Include API response samples.
- Enable Root Cause Analysis.
- Request multiple solutions for comparison.
- Use framework-specific instructions.
Common Mistakes to Avoid When Using AI Code Debugger
Many developers unintentionally reduce debugging effectiveness by omitting important details.
- Providing incomplete code snippets.
- Ignoring framework selection.
- Leaving out error messages.
- Skipping root cause analysis.
- Not testing generated fixes.
- Assuming AI suggestions are always perfect.
- Ignoring security recommendations.
- Overlooking performance warnings.
- Using vague custom instructions.
The AI Code Debugger works best when combined with developer expertise and proper testing practices.
AI Code Debugger Comparison Table
| Feature | AI Code Debugger | Traditional Debugging | Manual Code Review |
|---|---|---|---|
| Speed | Very Fast | Moderate | Slow |
| Error Detection | Automated | Partial | Manual |
| Root Cause Explanation | Included | Limited | Depends on Reviewer |
| Security Analysis | Available | Limited | Manual |
| Performance Suggestions | Available | Limited | Manual |
| Code Correction | Generated Automatically | No | Manual |
| Learning Support | High | Medium | High |
| Beginner Friendly | Excellent | Moderate | Depends on Reviewer |
Advantages of AI Code Debugger
- Fast debugging process.
- Supports multiple languages.
- Detailed explanations.
- Improves productivity.
- Provides corrected code.
- Helps developers learn.
- Identifies security concerns.
- Offers optimization guidance.
Limitations to Consider
- Requires accurate input.
- May need human validation.
- Complex architectures may require additional context.
- Generated fixes should be tested.
- Business logic still requires developer review.
AI Code Debugger for Different Developer Types
The versatility of the AI Code Debugger makes it valuable across different skill levels and industries.
Students
Students can learn programming concepts faster by understanding why bugs occur and how professional developers resolve them.
Freelancers
Freelancers can reduce troubleshooting time and deliver projects more efficiently to clients.
Startup Teams
Startups can accelerate development cycles and maintain code quality while operating with limited engineering resources.
Enterprise Developers
Large organizations can use AI-assisted debugging to improve productivity, streamline reviews, and support development teams working across complex applications.
Technical Content Creators
Bloggers, educators, and instructors can validate code examples before publishing tutorials and educational materials.
Ready to start debugging smarter? Try the tool here: AI Code Debugger.
Frequently Asked Questions About AI Code Debugger
What is an AI Code Debugger?
An AI Code Debugger is an intelligent debugging tool that analyzes source code, identifies programming errors, explains root causes, and recommends fixes. It helps developers solve coding issues faster than traditional manual debugging methods.
Is the AI Code Debugger free to use?
Yes. AIToolsay provides a free AI code debugger that allows users to analyze code, investigate bugs, and receive AI-powered debugging assistance without additional software installation.
Which programming languages are supported?
The tool supports popular languages including PHP, JavaScript, Python, Java, C++, C#, TypeScript, Go, Rust, Swift, and Kotlin.
Can AI Code Debugger fix code automatically?
Yes. When the Generate Corrected Code option is enabled, the tool can provide revised code examples along with explanations of the changes that were made.
Can the AI Code Debugger find security vulnerabilities?
Yes. The Security Check option helps identify risky coding practices, potential vulnerabilities, insecure configurations, and common security issues that may affect application safety.
Does AI Code Debugger support frameworks?
Yes. The tool supports framework-specific debugging for Laravel, React, Vue, Next.js, Node.js, Django, Flask, Express, Tailwind CSS, Bootstrap, and more.
Can beginners use AI Code Debugger?
Absolutely. The Beginner Friendly explanation mode simplifies technical concepts and explains issues in an easy-to-understand manner.
Can AI Code Debugger help with API issues?
Yes. Developers can submit API errors, request logs, response payloads, and integration code to receive detailed debugging recommendations.
Can it identify performance bottlenecks?
Yes. The tool can review inefficient code patterns and recommend optimization opportunities to improve application speed and scalability.
Should developers still test AI-generated fixes?
Yes. AI recommendations should always be reviewed and tested in development or staging environments before deployment to production systems.
AI Code Debugger for Modern Development Workflows
Modern software development moves quickly. Teams frequently deploy updates, integrate APIs, manage databases, maintain frontend frameworks, and support growing user bases. As applications become more complex, debugging becomes increasingly important.
The AI Code Debugger helps developers adapt to these challenges by providing intelligent analysis and actionable recommendations in real time.
Instead of spending valuable hours searching through logs and reviewing files manually, developers can use an AI debugging assistant tool to identify issues more efficiently and focus on building better software.
Whether you are troubleshooting a Laravel application, debugging React components, fixing Node.js API issues, optimizing database queries, or reviewing Python automation scripts, AI-assisted debugging can significantly improve productivity.
AI Code Debugger and the Future of Software Development
Artificial intelligence is transforming how developers write, review, test, and maintain software. Modern debugging tools are no longer limited to identifying syntax mistakes. They can understand context, analyze architecture patterns, explain root causes, and suggest improvements.
The future of development will likely include AI-powered assistance throughout the entire software lifecycle, from planning and coding to testing, deployment, monitoring, and maintenance.
The AI Code Debugger represents an important step in this evolution by helping developers solve problems faster while improving their technical understanding.
As AI technologies continue advancing, debugging tools will become even more accurate, context-aware, and capable of supporting increasingly complex applications.
Why Developers Trust AI Code Debugger
Developers value tools that save time, reduce frustration, and improve code quality. The AI Code Debugger delivers these benefits through intelligent analysis, customizable workflows, and detailed explanations.
- Accelerates bug detection.
- Provides understandable explanations.
- Supports multiple programming ecosystems.
- Improves code quality.
- Encourages best practices.
- Assists with security reviews.
- Helps optimize application performance.
- Supports learning and professional growth.
- Reduces development bottlenecks.
- Enhances team productivity.
Great developers do not avoid bugs. They identify, understand, and solve them efficiently. AI-powered debugging helps make that process faster and more productive.
AIToolsay Creator
Final Conclusion on AI Code Debugger
The AI Code Debugger is far more than a simple error checker. It functions as a comprehensive coding error finder, source code debugger, AI programming bug fixer, and intelligent development assistant capable of helping developers analyze, understand, and resolve coding issues with greater speed and confidence.
By supporting multiple programming languages, framework-specific debugging, root cause analysis, security reviews, performance optimization, and corrected code generation, the tool provides a practical solution for modern development teams and individual programmers alike.
Whether you are a student learning your first programming language, a freelancer building client projects, a startup launching products, or an enterprise developer maintaining large applications, the AI Code Debugger can help streamline your workflow and improve software quality.
AIToolsay makes advanced AI-powered debugging accessible through a single platform that provides access to premium AI technologies from leading providers including Google Gemini, OpenAI ChatGPT, Claude AI, DeepSeek, Qwen, Grok AI, Meta AI, NVIDIA AI, OpenRouter AI, MiniMax, and MSB AI.
If you want faster debugging, better code quality, stronger security, and improved development productivity, the AI Code Debugger is an excellent addition to your software development toolkit.
Thank you for reading this guide. We invite you to explore more AI tools on AIToolsay, test the AI Code Debugger for your next project, and stay connected through our social media channels, push notifications, and newsletters for the latest AI tool updates, development resources, feature releases, and productivity insights.
Join the Newsletter
Get the best new AI tools and tips delivered to your inbox. No spam.
By subscribing you agree to receive emails from AIToolsay. Unsubscribe anytime.